

In today’s fast-paced digital world, more and more companies rely on the power of data and insights from data sets to drive business and inform decisions. Data analytics is affording corporations the ability to define their futures purposefully. Data processing capabilities have created intuitive corporate leaders by arming them with trends and patterns to help with effective decision-making. A survey of global industries would point to a sharp increase in data-driven decision-making over the past five years. As data is continuing to transform industries, the construction business is no exception.
Similar to other industries, an obstacle in the construction business is the sheer amount of data. From sales to customer profiles to materials and accounts, the volume of data can be overwhelming. The construction industry oversees some of the biggest and most expensive projects. Large amounts of resources mean that there will be huge data sets. Difficulties arise with extracting new insights from these large amounts of data. Data visualization is aiding the construction industry by providing information graphics for making predictions and decisions. Let’s take a look at how data visualization can benefit your construction business.
Data Visualization
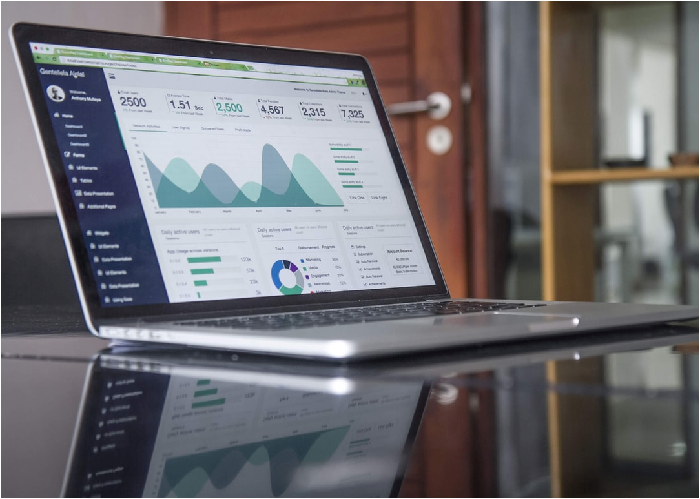
So, what is data visualization? It is the process of taking raw data and presenting it in a way that you can interpret visually. Data visualization creates graphical representations of information and data. Companies can use visual elements such as charts, graphs, and maps that data visualization tools provide to make better decisions. Visualization creates an easy way to see and understand trends, outliers, and patterns in data. Data visualization tools enable companies to digest complex data by removing the need to pour over seemingly incomprehensible sets of numbers. Sets of important information can be seen and understood immediately. Aside from traditional charts and graphs, this type of visualization can also migrate to displays and other visual representations across many devices.
Smaller Data
The most recent data visualization techniques now give companies the ability to analyze data in real-time. This will allow leaders to get immediate feedback about the correlation between company elements and metrics. More advanced data visualization will also highlight company shortcomings sooner. The process, however, wades through the massive amounts of big data to rely on smaller sets of information known as “small data.” This smaller data set is directly related to the construction company and the industry. This type of data visualization gives managers and owners the information to make immediate decisions to steer the company.
Customer Service
Data visualization creates an environment where clients and builders can work together to quickly evaluate things such as differences in prices, changes in plans, and material demands. Program dashboards can provide clients and builders with pie charts, line charts, and bar graphs that show the correlation between dollars and projects in real-time. This means that construction companies can implement best practices that include working closely with clients to provide immediate customer service, answers, and solutions. Data visualization can drive better customer relations and allow for decision-making with real-time analytics. All parties can benefit from the reliability and effectiveness of visualization tools.
For construction companies and their clients, data visualization allows all parties with a stake in any project the opportunity for better collaboration. Good data visualization gives each party the ability to see and discuss graphic representations of the numbers real-time. Immediate and easy-to-understand insight into business operations and processes is the major benefit of visualizations. For the construction industry, it is the key to the future. Data analytics allows companies to spend less time, spend less money and manage materials better for an increased bottom line.